
Just how Amazing is The Amazing Race?
01 Dec 2015The Amazing Race
The Amazing Race is one of the few reality TV shows that managed to survive the bubble of the early 2000s, with good reason. Rather than just trying to play up interpersonal dramas (though there is some of that too), it is set up like a traditional game show with a series of competitions between teams of two, who travel to different cities throughout the world over the course of the show. Eleven teams start out the race, and typically the last team to finish each day’s challenges gets booted from the show until only three teams are left. These three teams then have a final day of competition, with the winner being awarded $1 million.
Winning first place on any day before the last one doesn’t matter much (though you get a small prize and some bragging rights), which is interesting, since it means that it is possible for the winning team to have never come in first place before the final leg. This got me wondering: if we think of the Race as an experiment which is trying to identify the best team, how good is it? What if we just gave teams a point for every first place win, and then saw which one got the most points, like a baseball series?
Modeling the Race
To try to answer this question, I build a simple model of the Race. I assume that each team has some fixed skill level (sampled from a standard normal distribution), and then on each leg their performance is the sum of this instrinc skill and some randomness (sampled from another normal with varying width). So every leg, the ranking of the teams will be their true skill ranking, plus some randomness (and there can be a lot of randomness on the race). Fans of the show will know that this is a very simplified model of the race (the legs aren’t totally independent, the teams can strategically interfere with each other, etc.) but this captures the basic idea. I ran simulated races 10,000 times for each level of randomness.
We can measure how effective the Race was at picking a winner, by seeing what true skill rank the winning team had. So if the team with the highest skill (number 1) wins, that means the race did a good job. If a team with a low skill rank (like 10) wins, then the race did a very bad job of picking the million-dollar winner. This plot shows the rank of the winning team, compared to chance ((1+11)/2=6).
![]()
This actually looks surprisingly good! Even at with lots of leg randomness (more than the actual skill difference between the teams) a team with a relatively high rank tends to win. Once the randomness gets to be an order of magnitude bigger than the differences between teams, the winner starts getting close to random.
Improving the Race
But how good is this relative to a simpler kind of competition, where the winner is the team with the most first-place wins? Rather than eliminating teams, all teams race all 9 legs, and the team coming in first the most wins the prize (ties are broken based on which team won most recently). Would this do better or worse?
![]()
Turns out this is a little bit better! In general the rank of the winning team tends to be higher, meaning that a “more deserving” team won the money. But the size of the gap depends on how much randomness there is in each leg of the race. Which point along these curves corresponds to the actual TV show?
To answer this, I took the per-leg rankings from the Amazing Race Wikia from the past 10 seasons. Yes, there are people way more obsessed with this show than me, who have been together databases of stats from each season. I measured how consistent the rankings were from each leg of the race. If there wasn’t any randomness, we’d expect these to have a perfect (Kendall) correlation, while if each leg is just craziness for all teams then the correlation should be near zero. I found that this correlation varied a bit across seasons, but had a mean of 0.0992. Comparing this to the same calculation from the model, this corresponds to a noise level of about sigma=2.2.
![]()
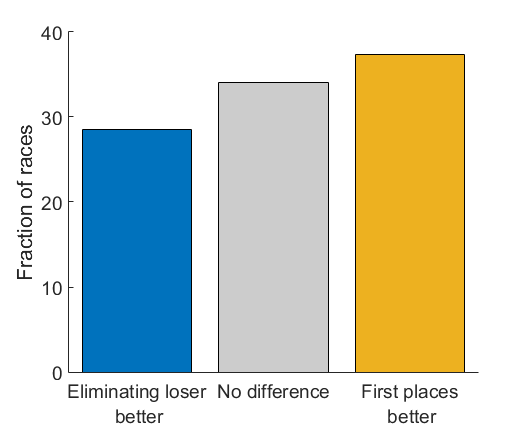
At this level of randomness, there is about a 10% advantage for counting-first-places competition: 37.4% of the time it picks a better team to win the money, while 28.5% of the time the current elimination setup picks a better team (they pick the same team 34.1% of the time).
Of course there are some disadvantages to counting first place wins: the requires all teams to run all legs (which is logistically difficult and means we get to know each team less) and the winner might be locked-in before the final leg (ruining the suspense of the grand finale they usually have set up for the final tasks). This is likely a general tradeoff in games like this, between being fair (making the right team more likely to win) and being exciting (keeping the winner more uncertain until the end). As a game show, The Amazing Race probably makes the right choice (entertainment over fairness) but for more serious matters (political debate performance?) maybe we should pay attention to the winner of each round rather than the loser.
All the MATLAB code and ranking data is available on my bitbucket.
Comments? Complaints? Contact me @ChrisBaldassano