
Split-Merge HMMs
19 May 2020HMM: the early years
Back in Spring 2015, when I had just started as a postdoc at Princeton, Janice Chen was wrestling with a data analysis problem in a new kind of dataset she had collected. She had fMRI data from subjects watching an hour-long movie and then freely recalling (over tens of minutes) the narrative. She wanted to see whether people’s brains during recall looked like they were replaying activity patterns during movie-watching - was it be possible to track which part of the movie people were thinking about during each moment of recall? I was absolutely captivated by this experiment, which broke all the rules about how you were supposed to collected fMRI data, especially since people were talking while being scanned (which conventional wisdom said should ruin your data). So I volunteered to help with analysis, which started as a side project and eventually turned into the main focus of my years at Princeton.
What we came up with was a Hidden Markov Model (HMM), which models brain activity while experiencing or remembering a story as proceeding through an ordered sequence of states, each corresponding to some event in the story. It turned out that in addition to movie-recall alignment, this model could do a bunch of other things as well, such as figuring out how to divide a story into events or detect anticipation of upcoming events in the story, and along with the paper describing the results we also released a python code for the HMM as part of the brainIAK toolbox. My lab and others have continued finding uses for this model, like this recent super-exciting preprint from James Antony.
My blog (when I remember to actually post things) usually is intended to give non-technical explanations of research, but in this post I’m going to get deeper into a) how the HMM finds event boundaries, and b) a recent update I made to the brainIAK code that improves how this fitting process works.
How the HMM fits data
Let’s look at a tiny simulated dataset, with 10 voxels and 20 timepoints:
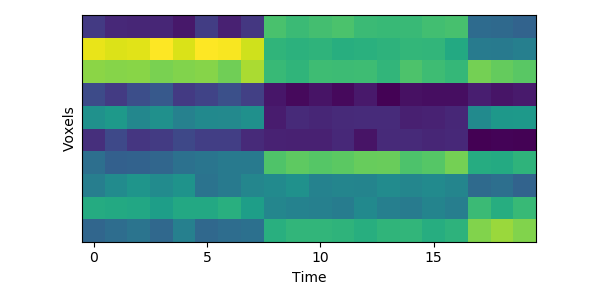
You can see visually where the event boundaries are - these are the timepoints (7 to 8, and 16 to 17) where the spatial pattern of activity across voxels suddenly shifts to a new stable pattern.
The HMM is using a probabilistic model to try to estimate a) what the patterns for each event look like, and b) which event each timepoint belongs to. This is a chicken-and-egg problem, since it is hard to cluster timepoints into events without knowing what they look like (and the boundaries between events are usually much less obvious in real datasets than in this toy example). The way the HMM gets started is by using its prior estimate of where events are likely to be. Let’s plot these prior probabilities as black lines, on top of the data:
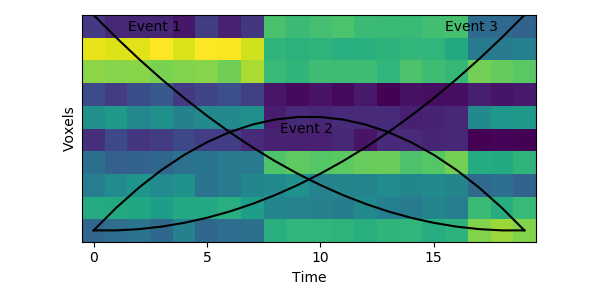
The HMM is certain that the first timepoint is in the first event and the last timepoint is in the last event, and the timepoints around in the middle are most likely to be in the second event. This prior distribution comes from summing over all possible sets of event boundaries - if we wrote down every possible way of slicing up these 20 timepoints into 3 events, timepoint 10 would be in the second event about in about half of these.
Now that we have this initial guess of which events belong to each timepoint, we can make a guess about what each event’s pattern looks like. We can then use these patterns to make a better assignment of timepoints to events, and keep alternating until our guesses aren’t getting any better. Here is an animation showing this fitting procedure, with the event probability estimates on the top and the event voxel pattern estimates on the bottom:
We can see that the HMM can perfectly find the true boundaries, shifting the prior distributions to line up with the underlying data. Note that the HMM doesn’t explicitly try to find “event boundaries,” it just tries to figure out which event each timepoint is in, but we can pull out event boundaries from the solution by looking for where the event label switches.
How to confuse the (original) HMM
This original HMM has been shown empirically to work well on a number of different datasets, as mentioned above. The fitting procedure, however, isn’t guaranteed find the best solution. One thing the original HMM has trouble with is if the true event lengths are very far from the prior, with some events much smaller than others. For example, here is another simulated dataset:
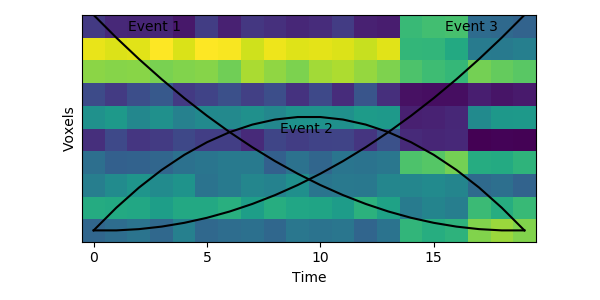
Here the first event is very long, which means that starting with the prior as our initial guess is not great. The HMM thinks that timepoint 13, for example, is much more likely to be in event 2 or 3 instead of event 1. When we start with this initial guess and run the fitting, here’s what happens:

The HMM correctly figured out that there is an event boundary between timepoints 13 and 14, but missed the other transition between 16 and 17. The problem is the event patterns for events 1 and 2 accidentally latch onto the same event, forcing event pattern 3 to cover the last two events. Once this starts happening, the model has no way to recover and re-allocate its event patterns. How can we give the HMM a way to escape from its bad decisions?
Split-Merge HMM to the rescue
In the new version of brainIAK, I’ve now added a split_merge option to the EventSegment class. If enabled, this forces the HMM to try reallocating its events at every step of fitting, by finding a) neighboring pairs of events with very similar patterns, indicating that they should be merged, and b) events that could be split in half into two very different-looking events. It checks to see if it can find a better solution by simultaneously merging one of the pairs of (a) and splitting one of the events from (b), to keep the same number of events overall. The number of different combinations the HMM tries is controlled by a split_merge_proposals parameter (defaults to 1).
This will come at a cost of extra computational time (which will increase even more with more split_merge_proposals) - does this extra flexibility lead to better solutions? Let’s try fitting the simulated data with very uneven events again:
Near the end of fitting the HMM realizes that the first two events can be merged, freeing up an extra event to split the final six timepoints into two separate events, as they should be. You can also see the event patterns for events 2 and 3 jump rapidly when it performs this split-merge.
Testing on real data
This proof-of-concept shows that using split-merge can help on toy datasets, but does it make a difference on real fMRI data? I don’t have a conclusive answer to this question - if you are interested, try it out and let me know!
I did try applying both HMM variants to some real fMRI data from the brainIAK tutorial. This is group-average data from 17 subjects watching the 50 minutes of Sherlock, downsampled into 141 coarse regions of interest. Fitting the original and split-merge HMMs using 60 events and then comparing to human-annotated boundaries, the original HMM is able to find 18 out of 53 boundaries (p=0.01 by permutation test), while the split-merge HMM is able to find 21 (p=0.002). Using split-merge seems to help a bit at the beginning of the show, where observers label many short events close together. Here is a plot of the first 12 minutes of the data, comparing the HMM boundaries to the human-annotated ones:
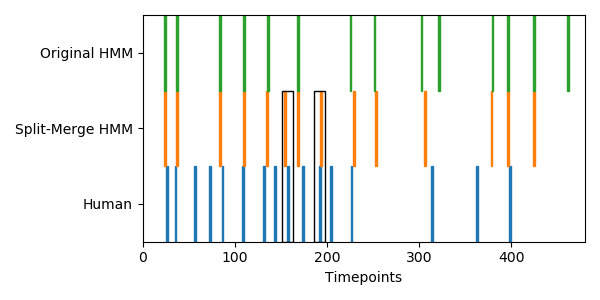
Both of the HMM variants are doing a decent job finding human-annotated boundaries, but the split-merge HMM is able to find some extra event boundaries (black boxes) that are perhaps too small for the original HMM to find.
More extensive testing will need to be done to understand the kinds of data for which this can help improve fits, but if you are willing to spend a little more time fitting HMMs then give split-merge a try!
Code to produce the figures in this post:
#%% Imports
from brainiak.eventseg.event import EventSegment
import matplotlib.pyplot as plt
from matplotlib.animation import FuncAnimation
import matplotlib.patches as patches
import deepdish as dd
import numpy as np
from scipy import stats


def generate_data(event_labels, noise_sigma=0.1):
    n_events = np.max(event_labels) + 1
    n_voxels = 10
    event_patterns = np.random.rand(n_events, 10)
    data = np.zeros((len(event_labels), n_voxels))
    for t in range(len(event_labels)):
        data[t, :] = event_patterns[event_labels[t], :] +\
                     noise_sigma * np.random.rand(n_voxels)
    return data


def plot_data(data, prob=None, event_patterns=None, create_fig=True):
    if create_fig:
        if event_patterns is not None:
            plt.figure(figsize=(6, 6))
        else:
            plt.figure(figsize=(6, 3))
    if event_patterns is not None:
        plt.subplot(2,1,1)
    data_z = stats.zscore(data.T, axis=0)
    plt.imshow(data_z, origin='lower')
    plt.xlabel('Time')
    plt.ylabel('Voxels')
    plt.xticks(np.arange(0, 19, 5))
    plt.yticks([])
    if prob is not None:
        plt.plot(9.5*prob/np.max(prob), color='k')

    if event_patterns is not None:
        plt.subplot(2,1,2)
        plt.imshow(stats.zscore(event_patterns, axis=0),
        	       origin='lower')
        plt.xlabel('Events')
        plt.ylabel('Voxels')
        n_ev = event_patterns.shape[1]
        plt.xticks(np.arange(0, n_ev),
                   [str(i) for i in range(1, n_ev+1)])
        plt.yticks([])
        plt.clim(data_z.min(), data_z.max())


def animate_fit(f, fname):
    plt.figure(figsize=(6, 6))
    frames = np.unique(np.round(np.logspace(0, 2.5, num=20)))
    anim = FuncAnimation(plt.gcf(), f, frames=frames, interval=300)
    anim.save(fname, dpi=80, writer='imagemagick')


def human_match(bounds, human_bounds, nTR, nPerm=1000, threshold=3):
    event_counts = np.diff(np.concatenate(([0], bounds, [nTR])))
    perm_bounds = bounds

    match = np.zeros(nPerm + 1)
    for p in range(nPerm + 1):
        for hb in human_bounds:
            if np.any(np.abs(perm_bounds - hb) <= threshold):
                match[p] += 1
        perm_counts = np.random.permutation(event_counts)
        perm_bounds = np.cumsum(perm_counts)[:-1]

    return match[0],  np.mean(match >= match[0])


def fit(t):
    plt.clf()
    es = EventSegment(3, n_iter=t)
    es.fit(data)
    plot_data(data, es.segments_[0], es.event_pat_, create_fig=False)


def fit_split_merge(t):
    plt.clf()
    es = EventSegment(3, n_iter=t, split_merge=True)
    es.fit(data)
    plot_data(data, es.segments_[0], es.event_pat_, create_fig=False)


def plot_bounds(bounds, n):
    w = 1
    for b in bounds:
        plt.gca().add_patch(patches.Rectangle(
        (b-w/2, n), 2, 1, color='C%d' % n))


#%% Simulation #1
event_labels = np.array([0,0,0,0,0,0,0,0,1,1,1,1,1,1,1,1,1,2,2,2])
np.random.seed(0)
data = generate_data(event_labels)
plot_data(data)
plt.show()

#%% Plot prior
es_prior = EventSegment(3)
prior = es_prior.model_prior(len(event_labels))[0]
plot_data(data, prior)
plt.text(1.5, 8.8, 'Event 1')
plt.text(8.2, 4.3, 'Event 2')
plt.text(15.5, 8.8, 'Event 3')
plt.show()


#%% Fitting simulation #1
animate_fit(fit, 'fit.gif')


#%% Simulation #2
event_labels = np.array([0,0,0,0,0,0,0,0,0,0,0,0,0,0,1,1,1,2,2,2])
np.random.seed(0)
data = generate_data(event_labels)
es_prior = EventSegment(3)
prior = es_prior.model_prior(len(event_labels))[0]
plot_data(data, prior)
plt.text(1.5, 8.8, 'Event 1')
plt.text(8.2, 4.3, 'Event 2')
plt.text(15.5, 8.8, 'Event 3')
plt.show()

#%% Fitting simulation #2
animate_fit(fit, 'fit_noms.gif')

#%% Fitting simulation #2 with merge/split
animate_fit(fit_split_merge, 'fit_ms.gif')

#%% Real fMRI data
sherlock = dd.io.load('sherlock.h5')
data = sherlock['BOLD'].mean(2).T
human_bounds = sherlock['human_bounds']
plt.figure(figsize=(10,3))
data_z = stats.zscore(data.T, axis=0)
plt.imshow(data_z[:20,:100], origin='lower')
plt.xlabel('Time')
plt.ylabel('Regions')
plt.xticks(np.arange(0, 100, 10))
plt.yticks([])
plt.show()

#%% Fitting real fMRI data
es = EventSegment(60)
es.fit(data)
no_ms_bounds = np.where(np.diff(np.argmax(es.segments_[0], axis=1)))[0]

es_ms = EventSegment(60, split_merge=True)
es_ms.fit(data)
ms_bounds = np.where(np.diff(np.argmax(es_ms.segments_[0], axis=1)))[0]

#%% Plots and stats
print(human_match(no_ms_bounds, human_bounds, data.shape[0]))
print(human_match(ms_bounds, human_bounds, data.shape[0]))

plt.figure(figsize=(6,3))
plt.axis([0, 480, 0, 3])
plot_bounds(human_bounds, 0)
plot_bounds(ms_bounds, 1)
plot_bounds(no_ms_bounds, 2)
plt.xlabel('Timepoints')
plt.yticks([0.5, 1.5, 2.5], ['Human', 'Split-Merge HMM', 'Original HMM'])

for i in range(len(human_bounds)):
    if np.any(np.abs(ms_bounds - human_bounds[i]) <= 3) and \
       not np.any(np.abs(no_ms_bounds - human_bounds[i]) <= 3) and \
       human_bounds[i] > 140:
        hb = human_bounds[i]
        plt.gca().add_patch(patches.Rectangle(
            (hb - 6, 0), 12, 2, color='k', fill=False))

plt.show()